
As of writing, AAVE holds the 44th position on the CoinMarketCap ranking with a market cap of $4,929,009,371. Here’s the daily price chart of AAVE.
AAVE Daily Timeframe
Analyzing the daily chart of the AAVE asset reveals several key points. Since June 2022, the coin has been in a consolidation phase within a relatively high price range, bounded by $45.70 and $79.37.
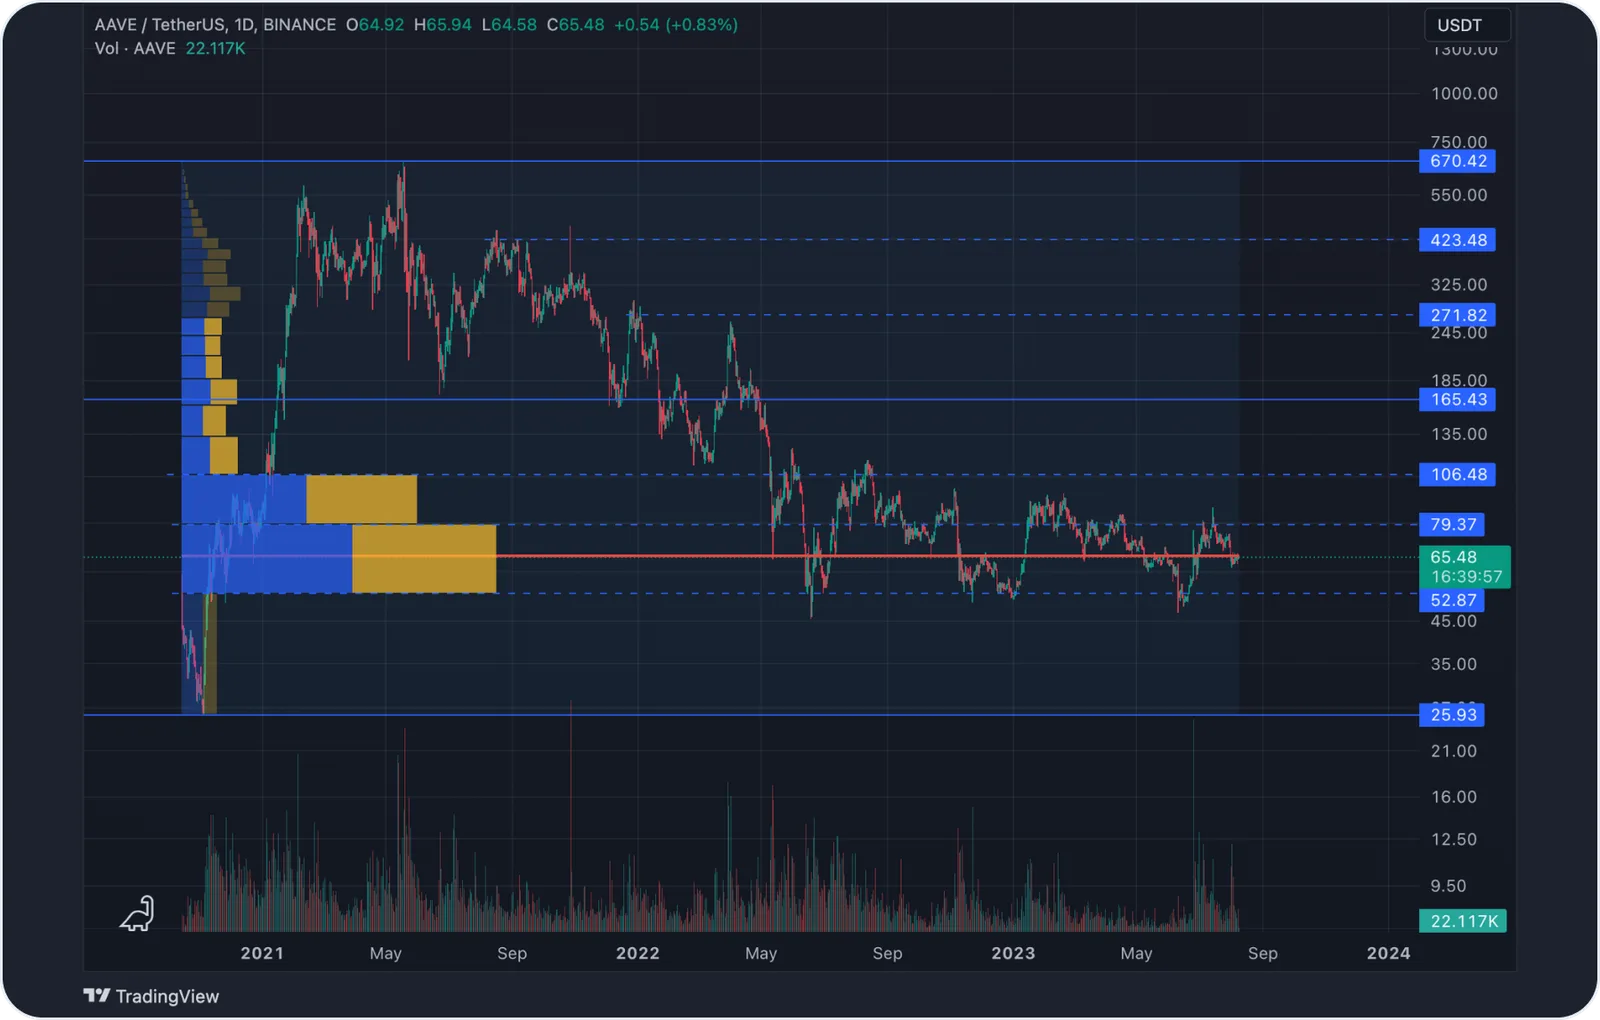
This range also encompasses a zone with the highest trading volume. Whenever the price touched the support level of $45.70, there was a notable response with an increase in trading volumes. This could indicate robust buyer interest at this price level.
The $45.70 support level has accumulated significant liquidity, and its breach could trigger a substantial decline in the asset's value. Therefore, monitoring trading dynamics and volumes as it approaches this level is important.
AAVE Price Prediction
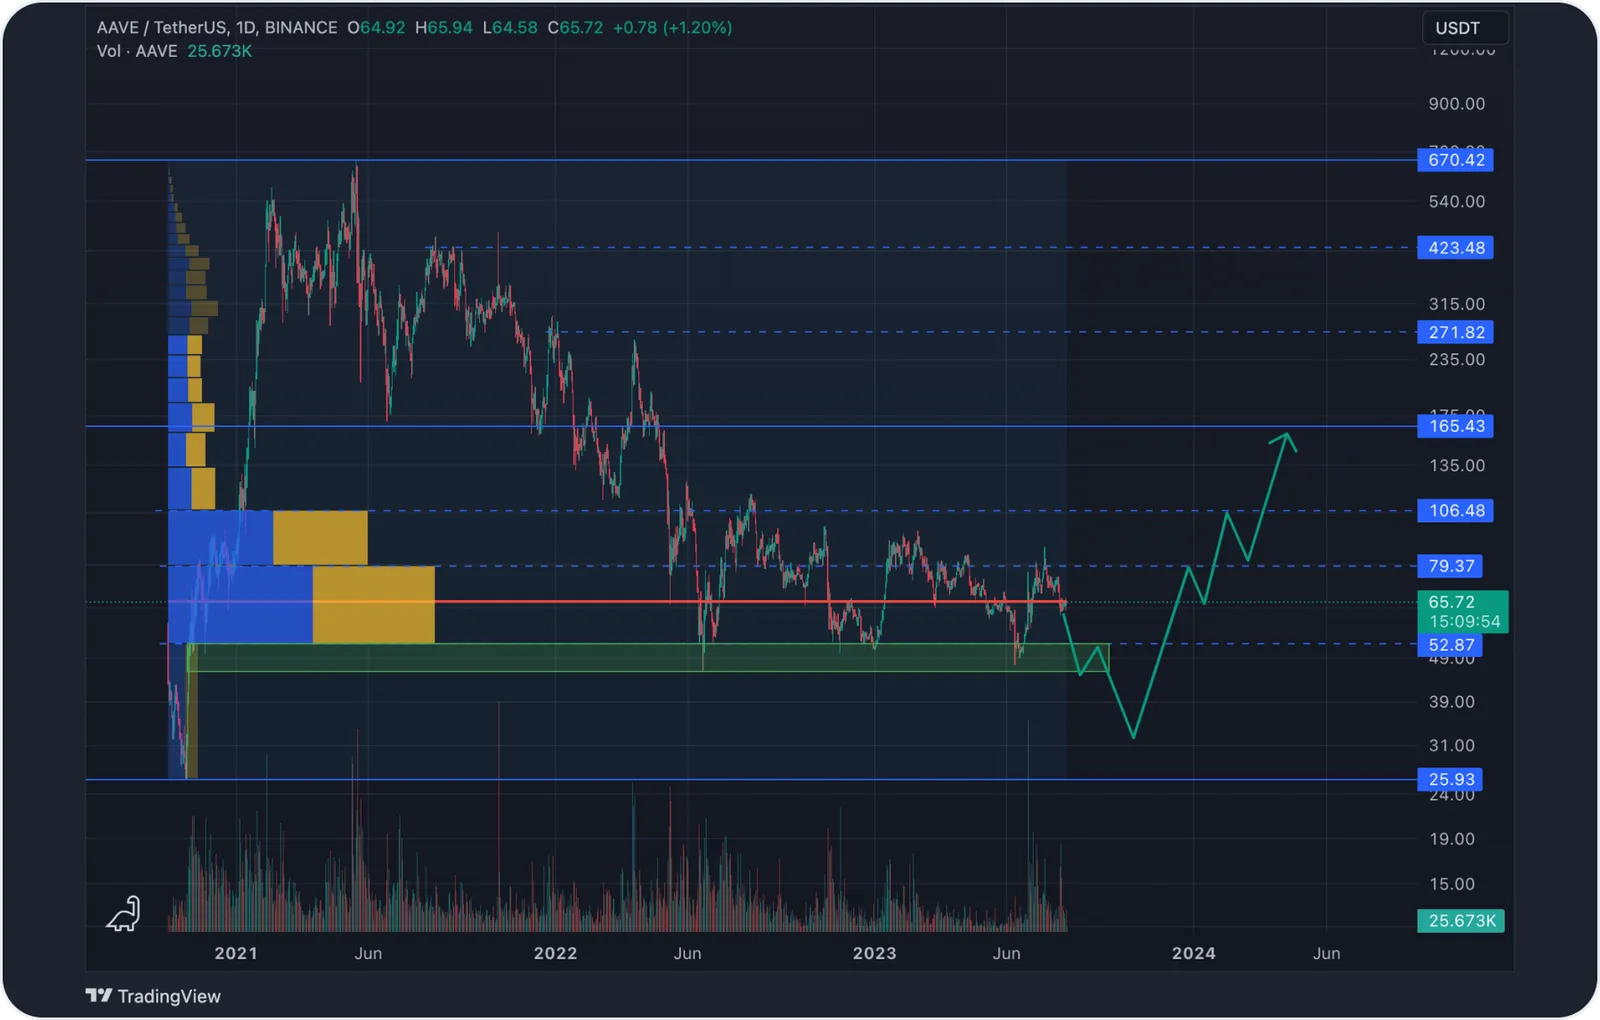
Let's explore potential scenarios for the AAVE asset. Presently, the coin is trading around the Point of Control (POC) at the $65.72 level, attracting attention due to active trading.
It's essential to consider the possibility of a price decline below $45.70, which could potentially lead to a reversal and subsequent rise towards the initial resistance level at $79.37. Breaking through this level paves the way for further milestones at $106.48 and $165.43.
Our skilled SimpleSwap analyst offers a trading scenario with AAVE on TradingView.
Users can get AAVE for fiat or crypto on SimpleSwap.