
As of writing, TRX holds the 10th position on CoinMarketCap with a market cap of $6,931,116,801.
TRX Technical Analysis
Here’s the daily price chart of TRX since the beginning of 2023.
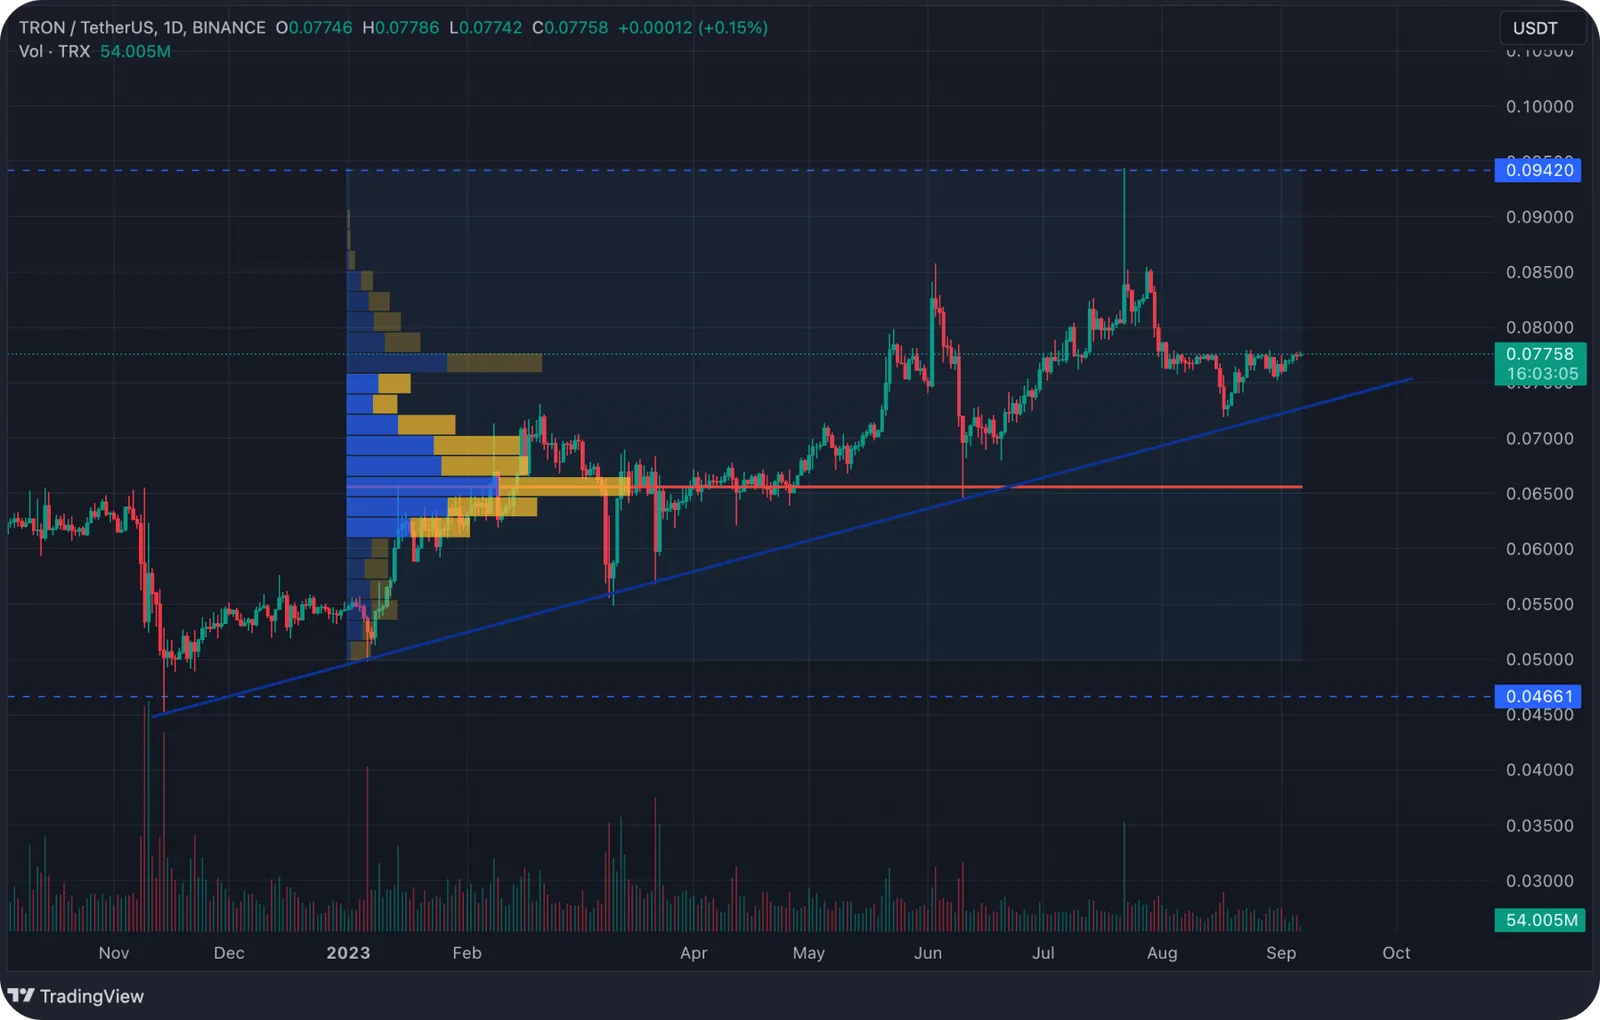
The initial minimum price was $0.05. The next significant stage was a rise to a maximum value of $0.094, representing an increase of more than 89%. The price chart of TRX on the daily timeframe shows a prominent ascending level, serving as a strong support level. This level has already experienced six touches and subsequent price rebounds.
TRX Price Prediction
At the price level of $0.065, a strong volume level POC (Point of Control) has formed, which may potentially act as support during a possible correction.
The price movement outlook appears as follows: In the short term, we can anticipate a price increase from the $0.076 level, supported by an increase in trading volume at this level. The potential price target could be the resistance level at $0.094.
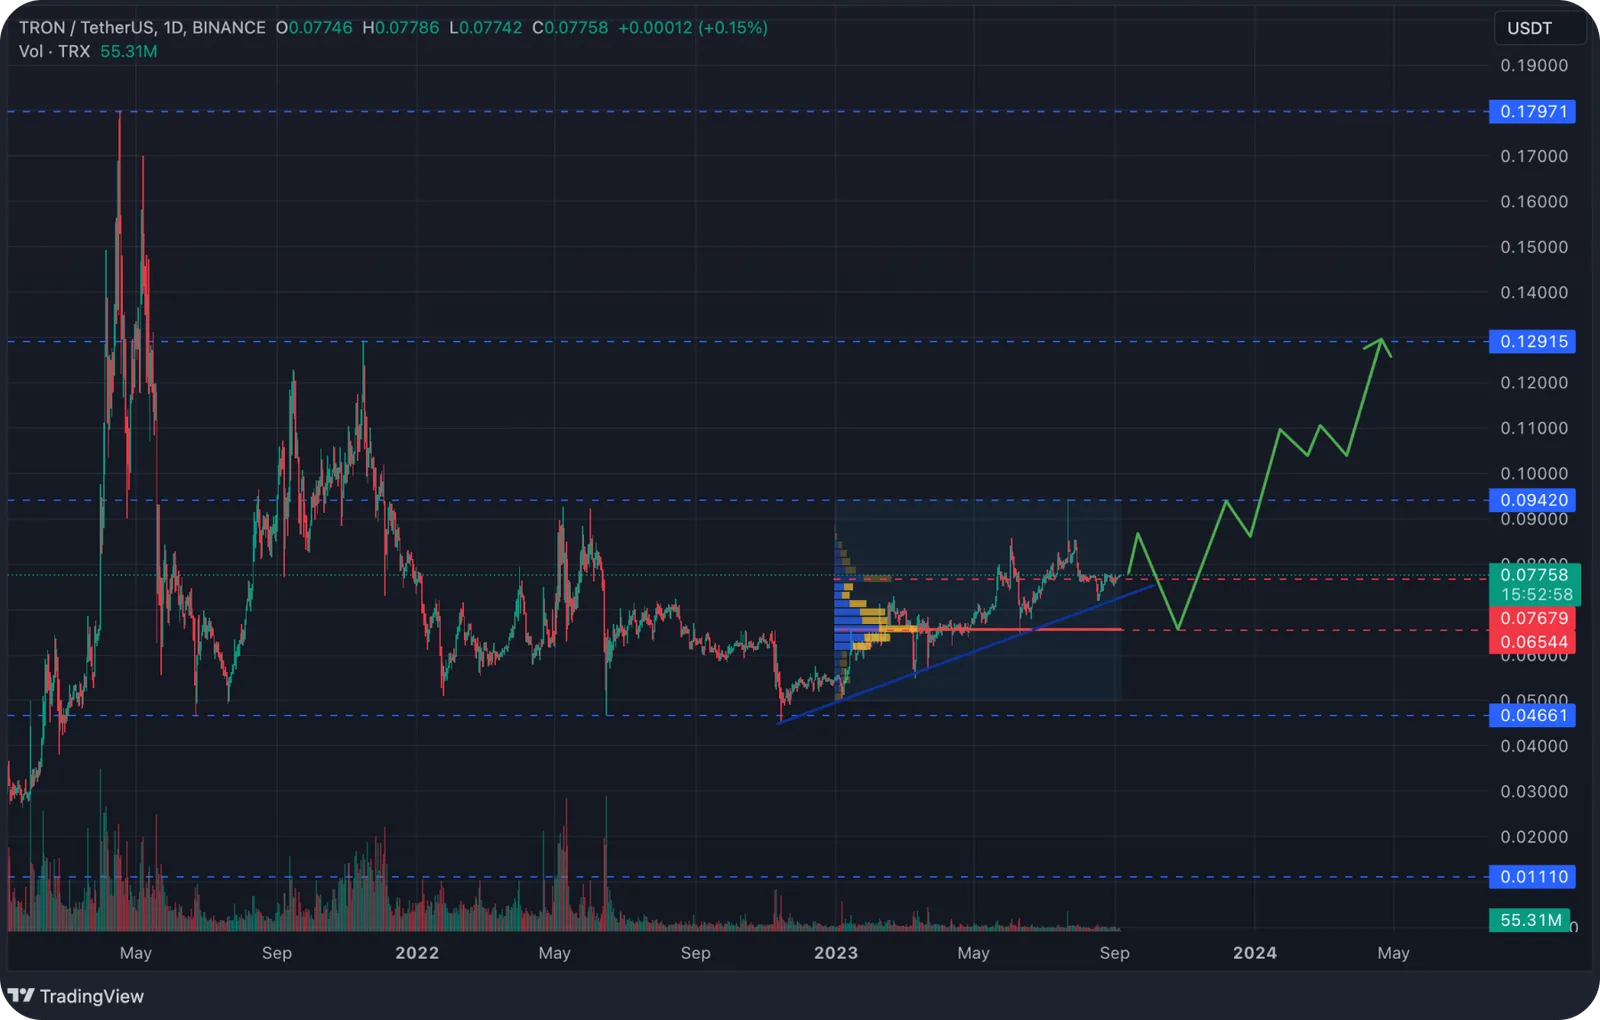
Subsequently, a price correction may occur, retracing to the volume level POC to gather liquidity. If the volume level POC proves to be reliable support, we can expect a price reversal and an upward movement towards the $0.094 target.
Achieving this target may pave the way for further price growth to the $0.129 level.
Our skilled SimpleSwap analyst offers a trading scenario with TRX on TradingView.
Users can get TRX for fiat or crypto on SimpleSwap.